About:
Memory Lane is an experimental research project I developed for the Future Curiosity Lab at Bangkok City Lab. It explores how people’s everyday relationships with their neighborhoods can be made visible. The project translates individual experiences such as relationships with place, people, and community life into forms that can be read at three different scales: as a personal interpretation, as a collective portrait, and as patterns across a dataset.
The project consists of three connected modules:
Module 01 · Questionnaire
A short questionnaire interprets each participant’s relationship with their neighborhood through a theory-led multidimensional scoring model. It produces a data portrait and one of 27 archetypes, expressed through a contemporary Siemsi fortune slip.
Module 02 · Stock & Flow
The participatory artwork, originally designed as an art installation for public exhibition and presented here, brings individual data portraits together into a collective composition, in which each person remains visible while becoming part of a collective portrait formed from responses across the city.
Module 03 · Data Analysis
An analytical dashboard explores patterns across the collected responses, including relationships between place, time, demographics, and different forms of neighborhood connection.
User Guide:
Timestamp
Arranges portraits in the order responses were entered into the dataset.
District
Groups portraits by reported district or area.
Formation
Recomposes the portraits into alternative spatial arrangements.
Auto
Moves automatically between different views.
Select a Data Portrait
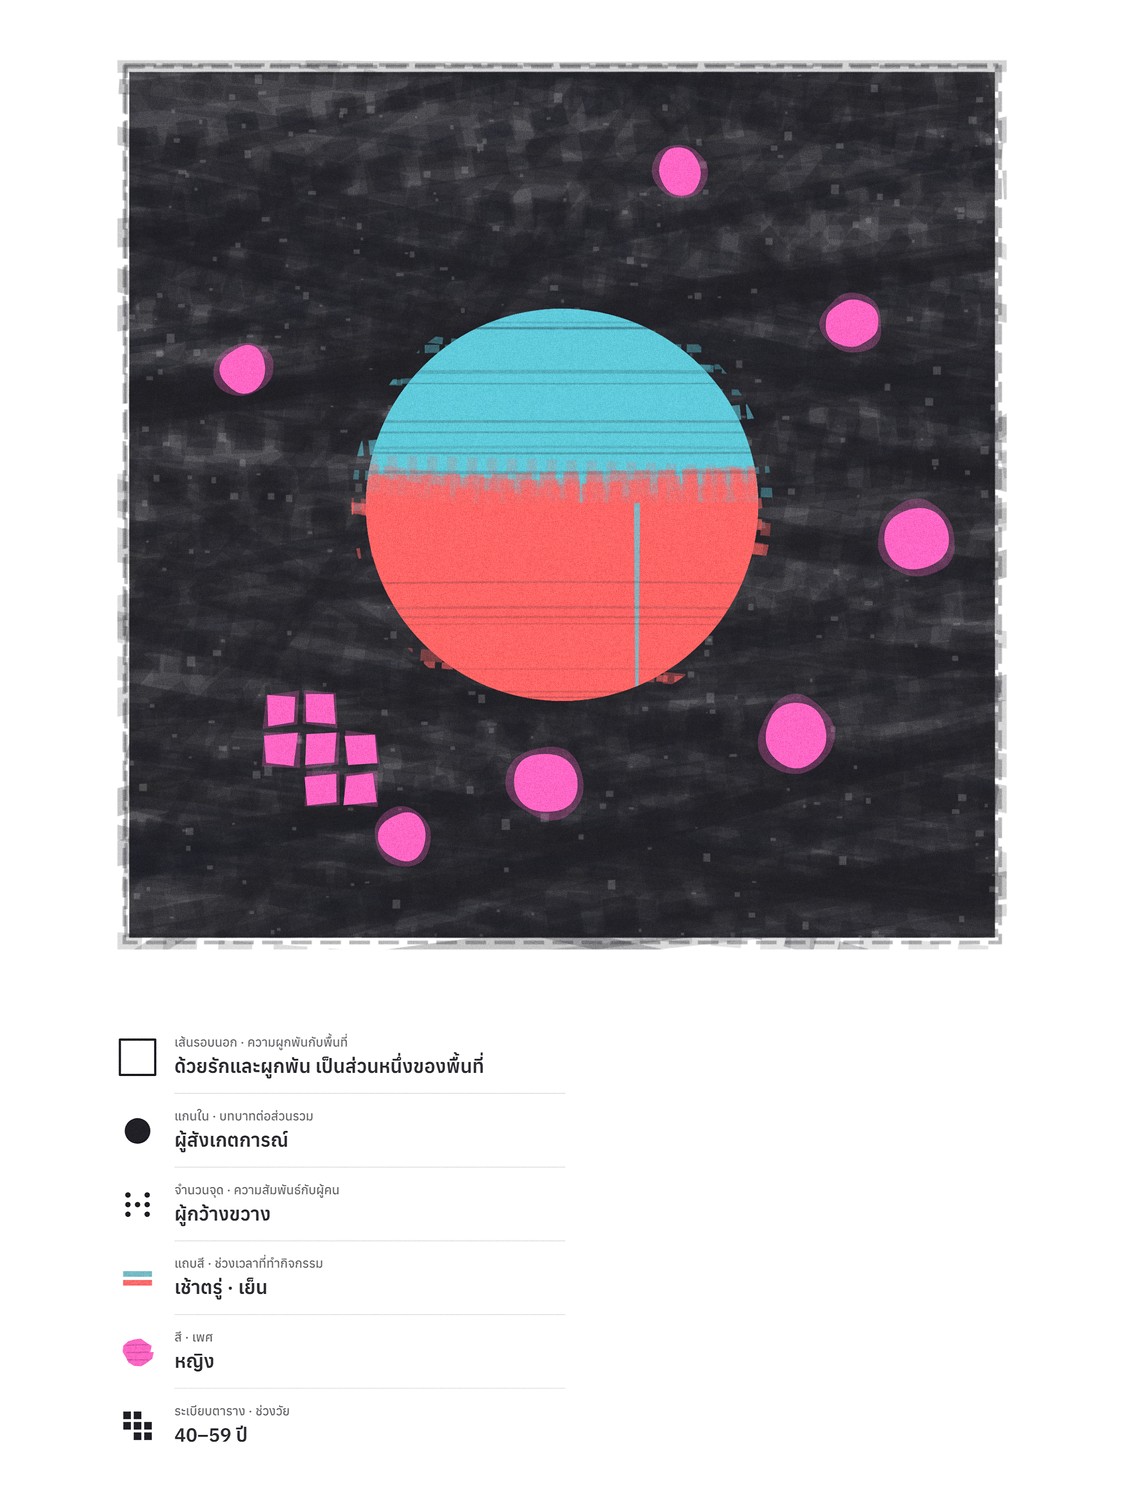
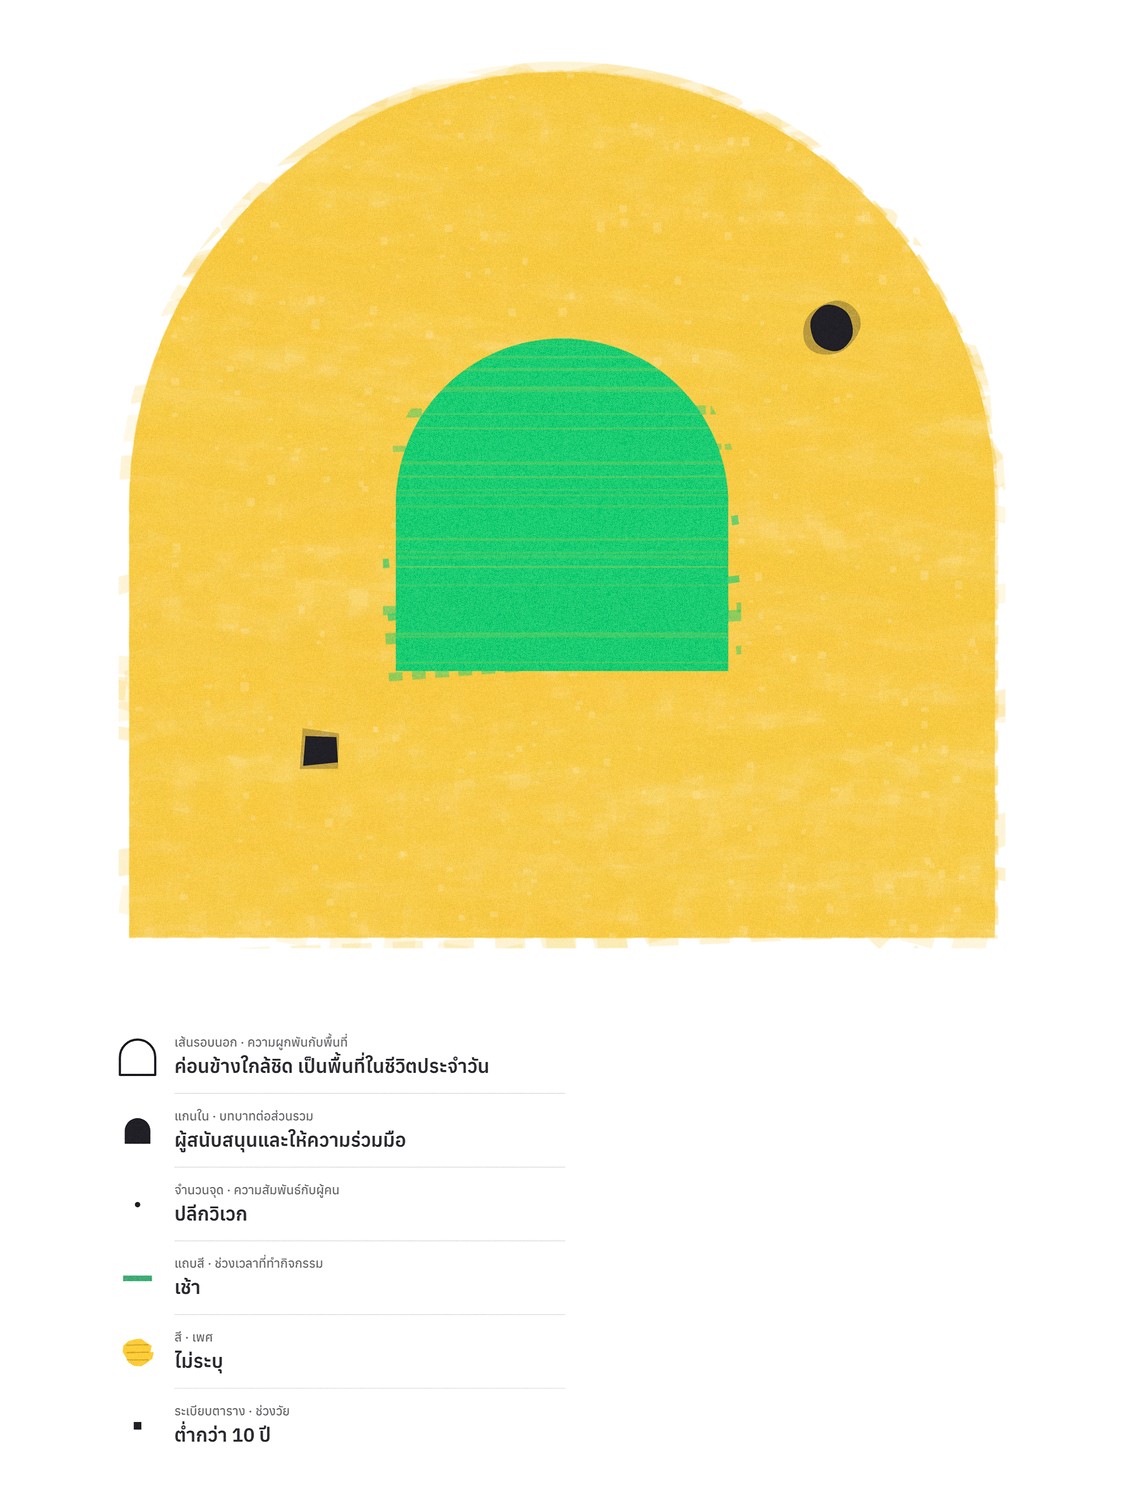
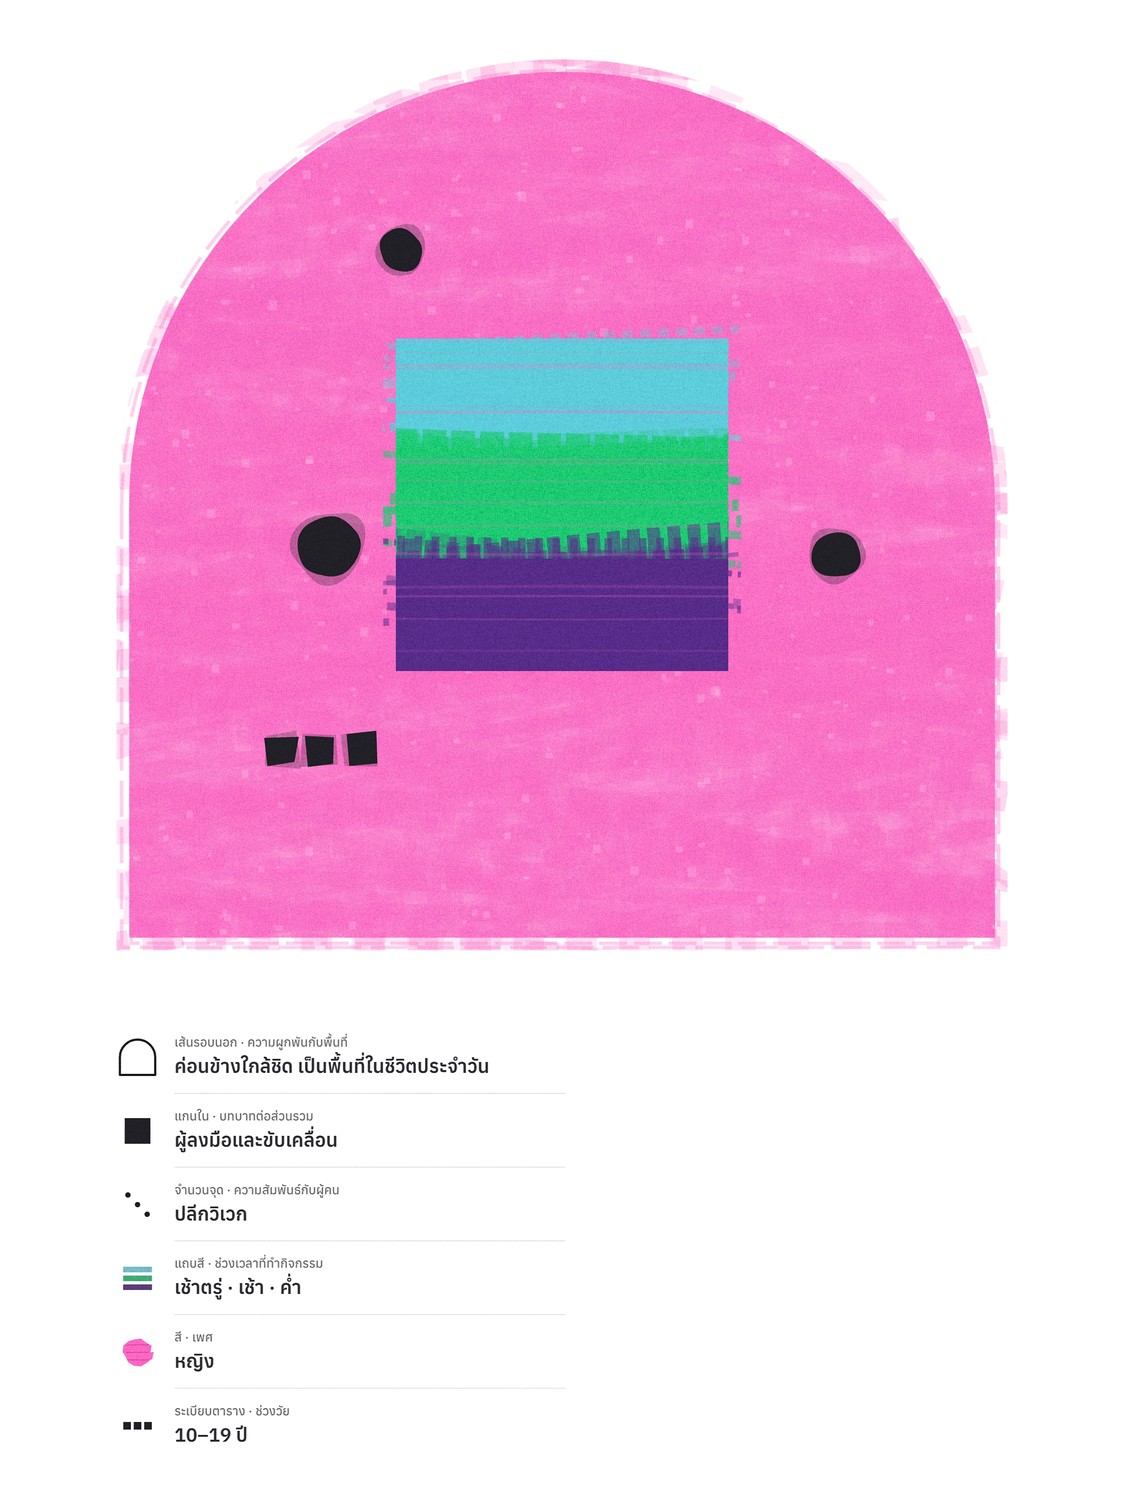
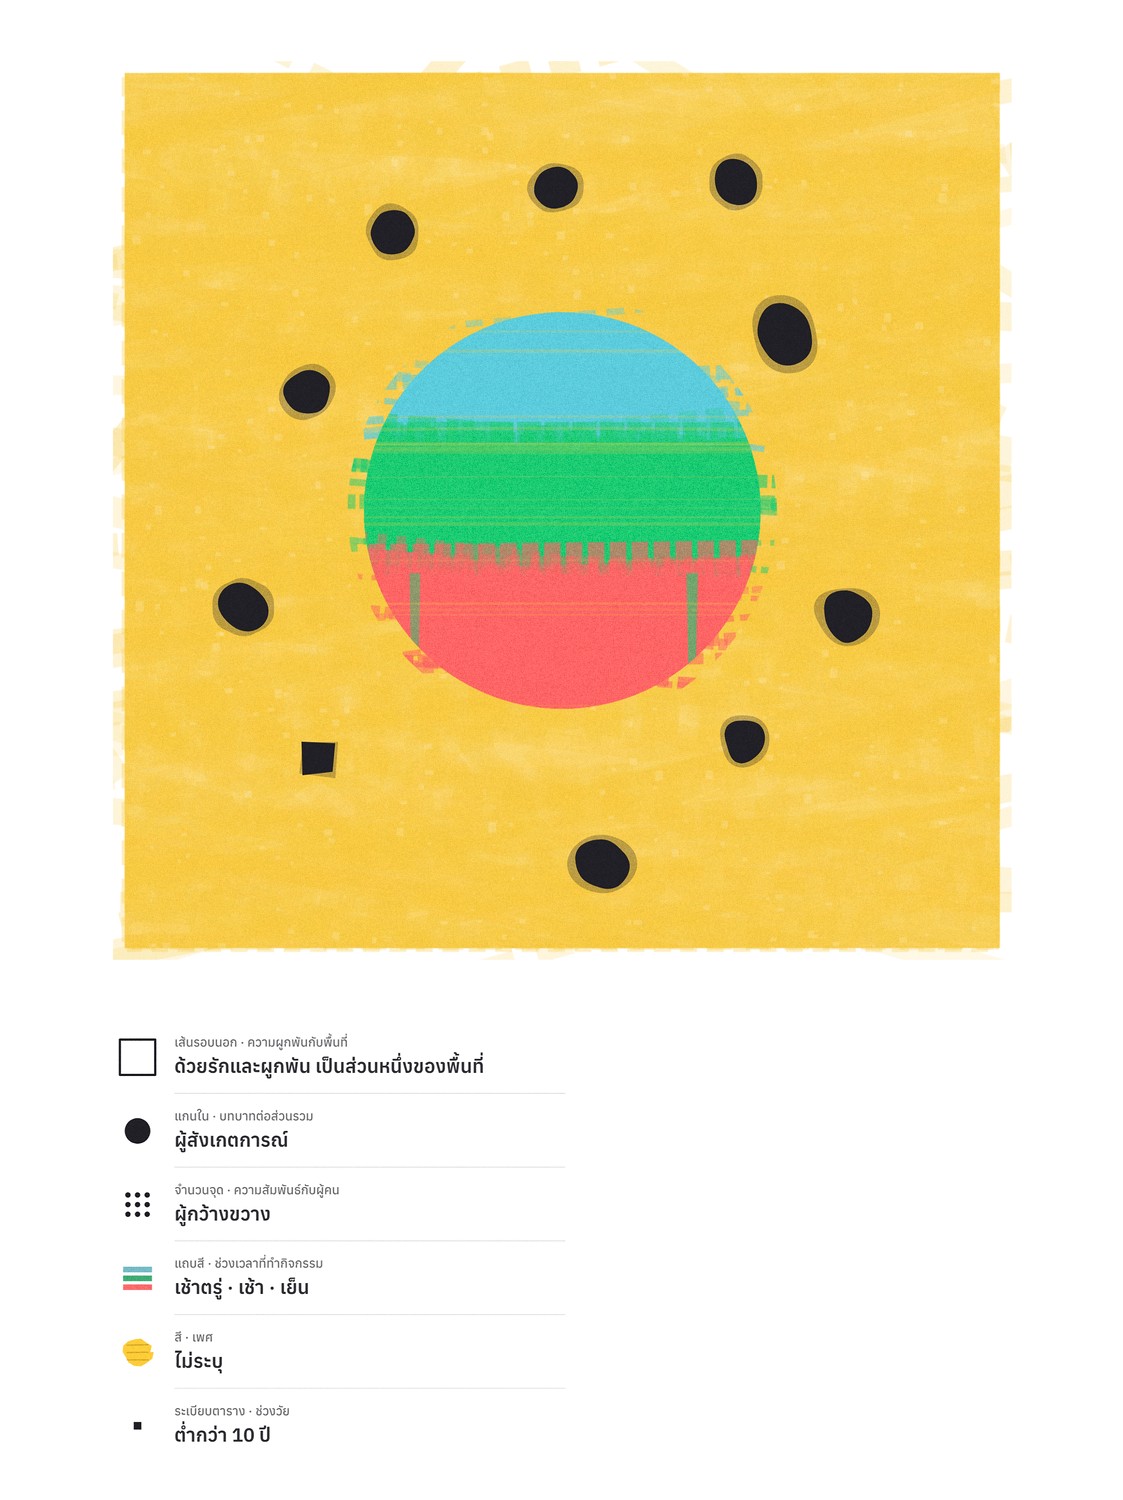
Click a portrait to open its legend and see how its visual features are derived from the underlying data.
ร่วมบันทึกความทรงจำแถวบ้าน
Visitors can also take part in Memory Lane · Module 01 through this button. Completing the questionnaire creates a personal data portrait and adds it to the collective dataset presented in Stock & Flow.
This work is licensed under CC BY-NC-SA 4.0


Data Portrait Legend: Sample
A data portrait generated from each participant’s responses.
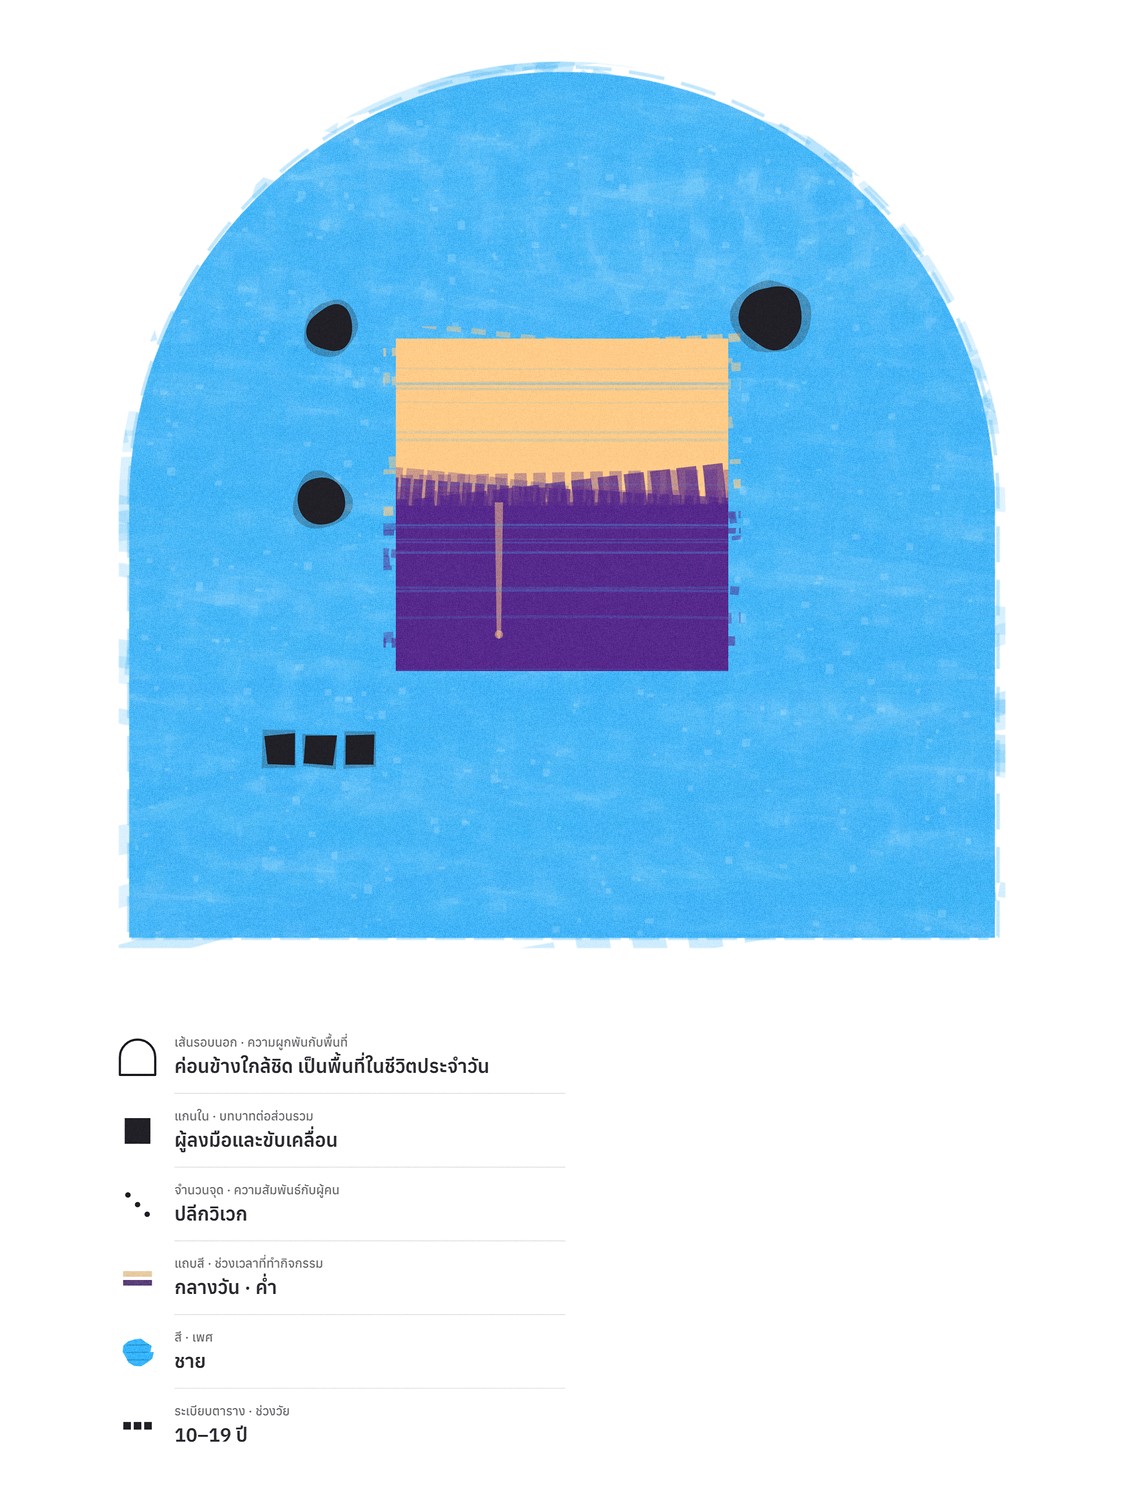
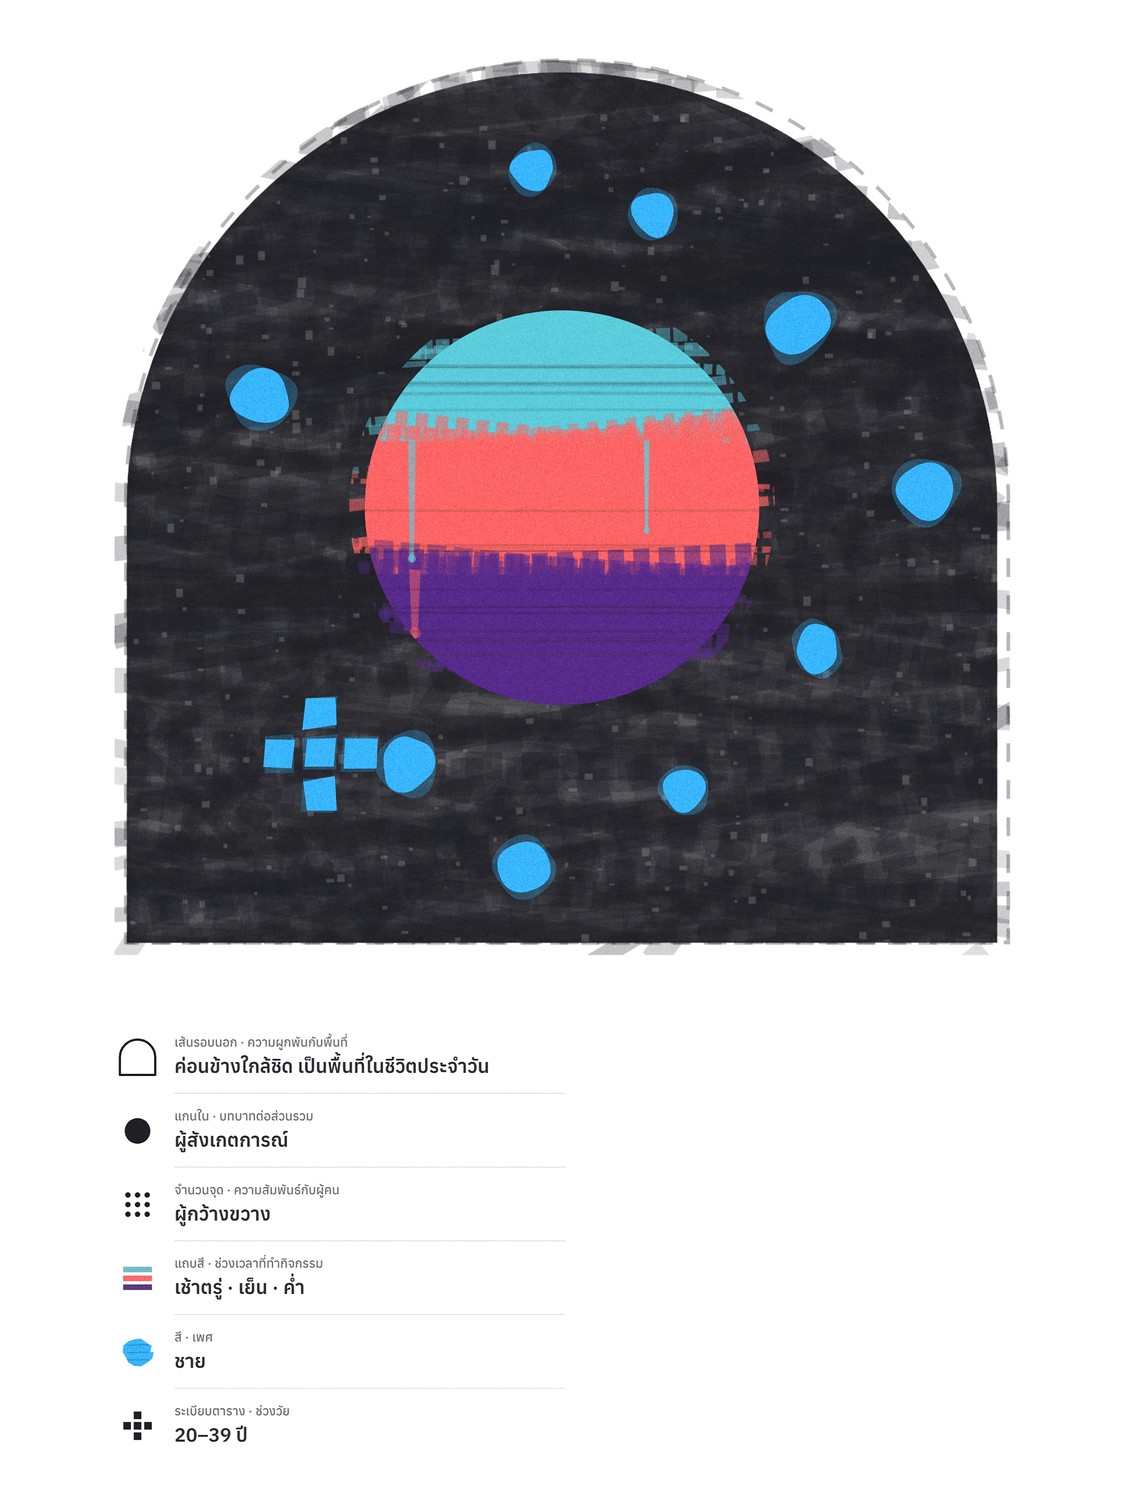
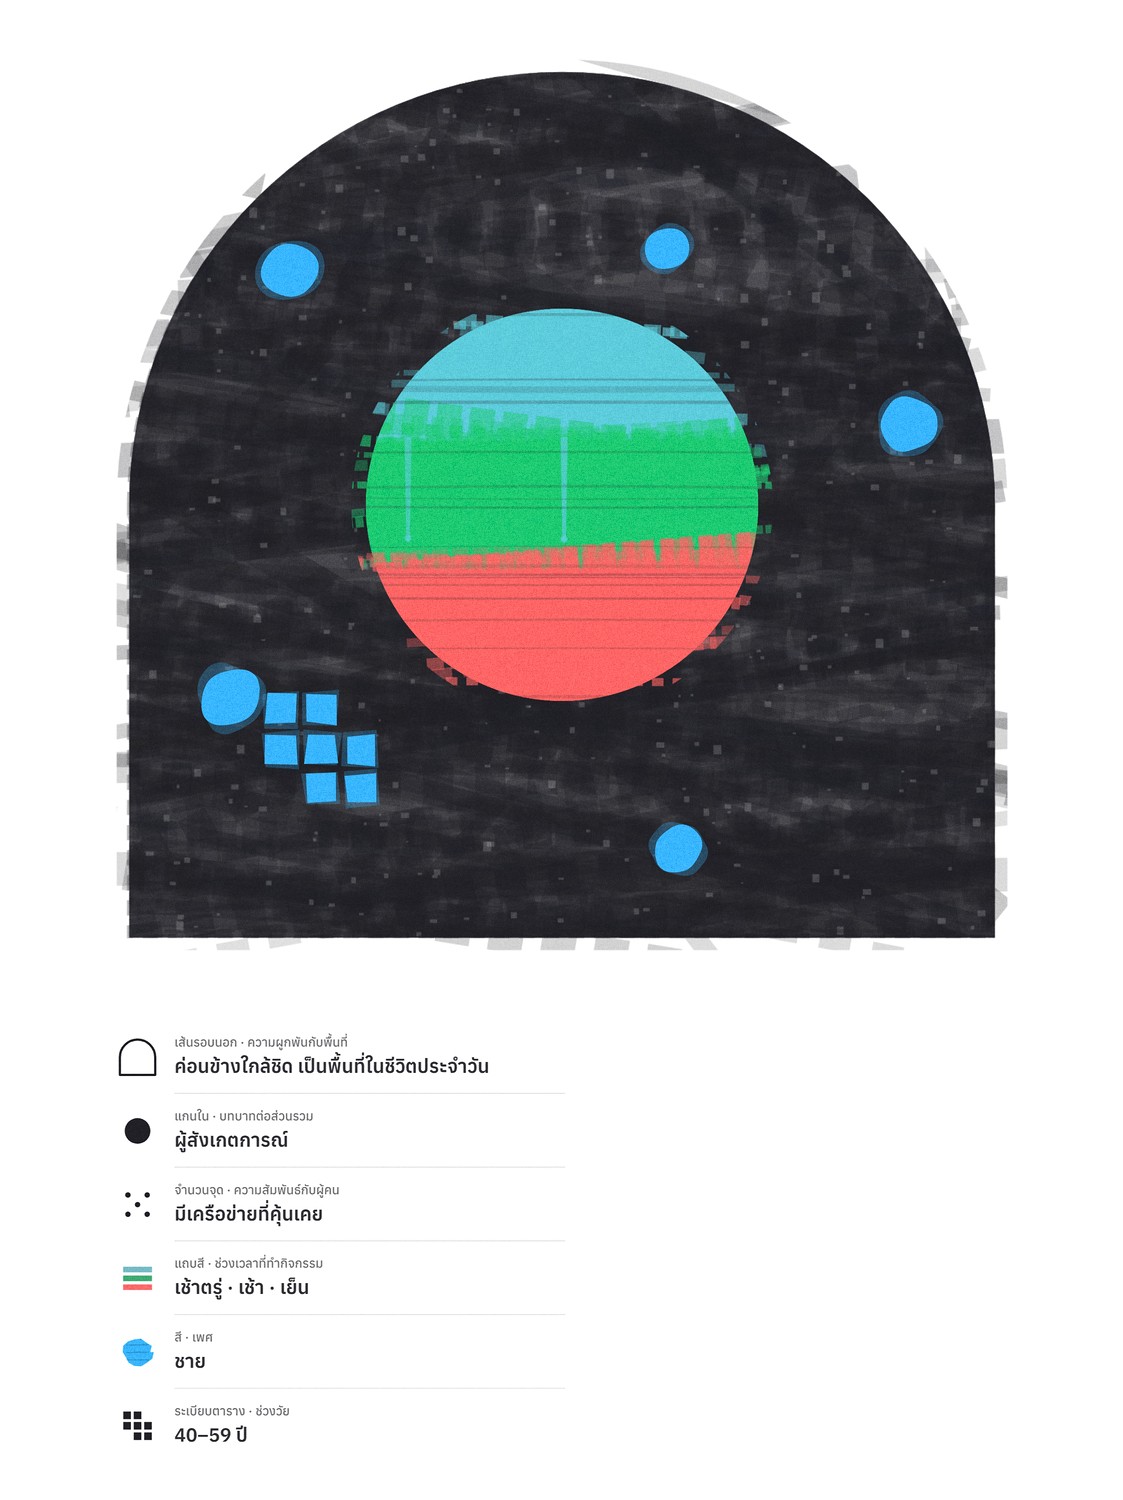
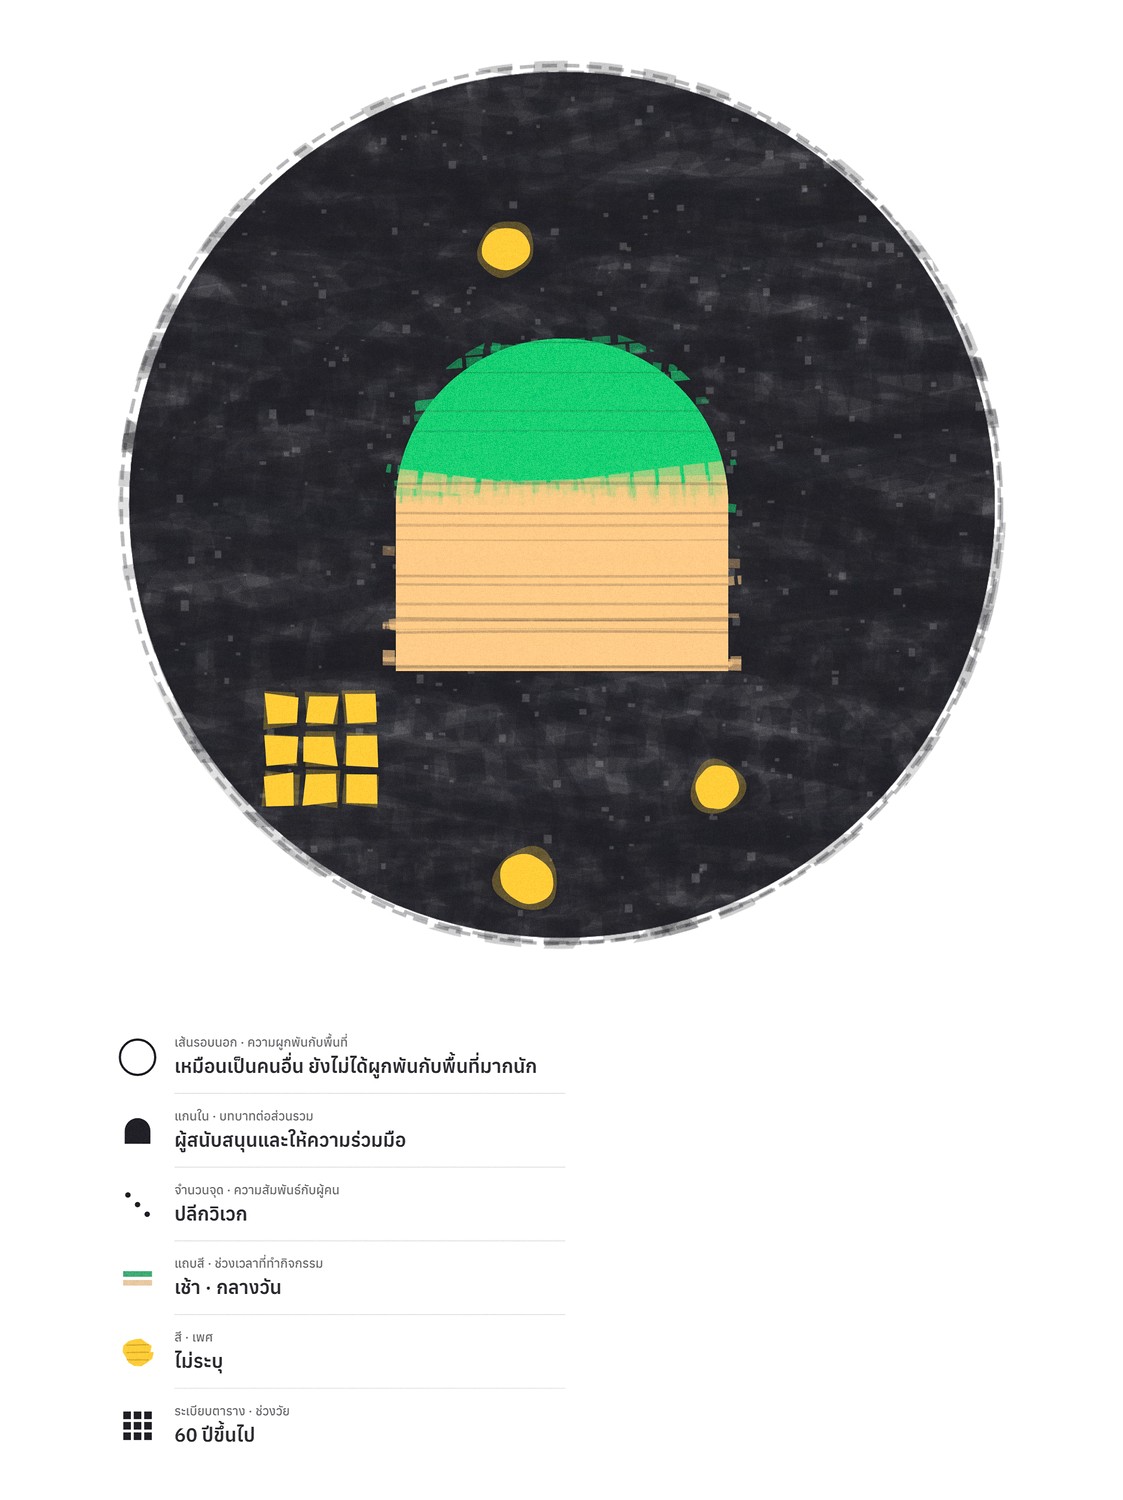
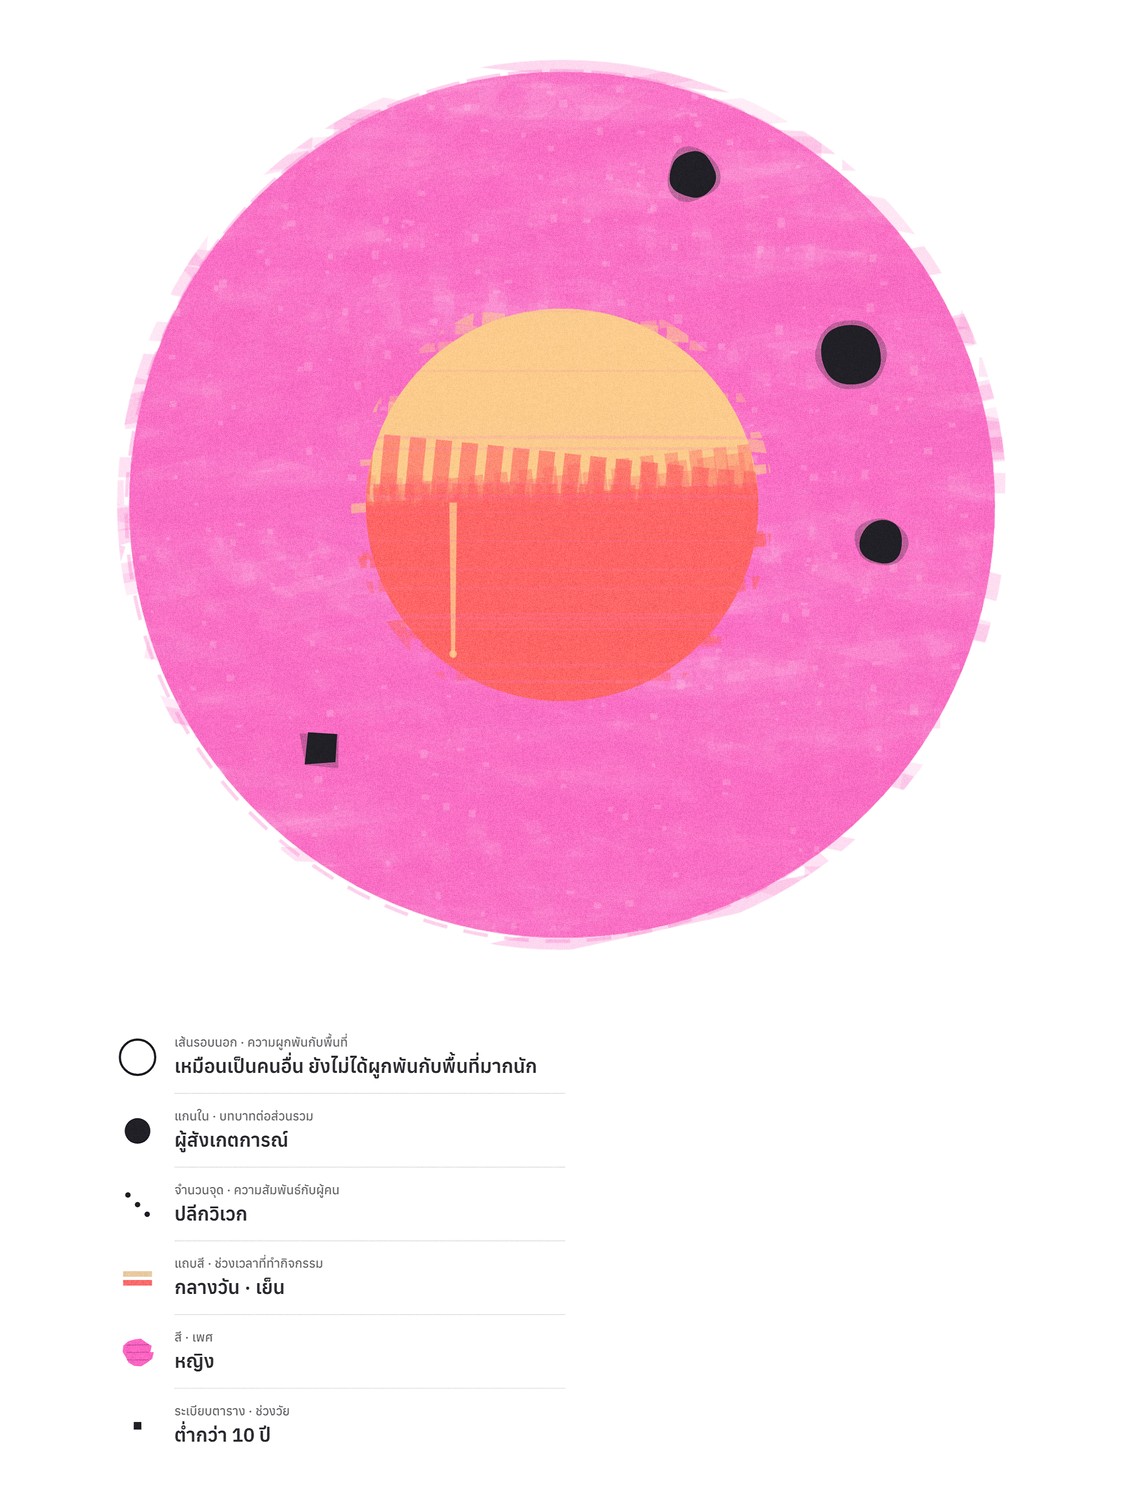
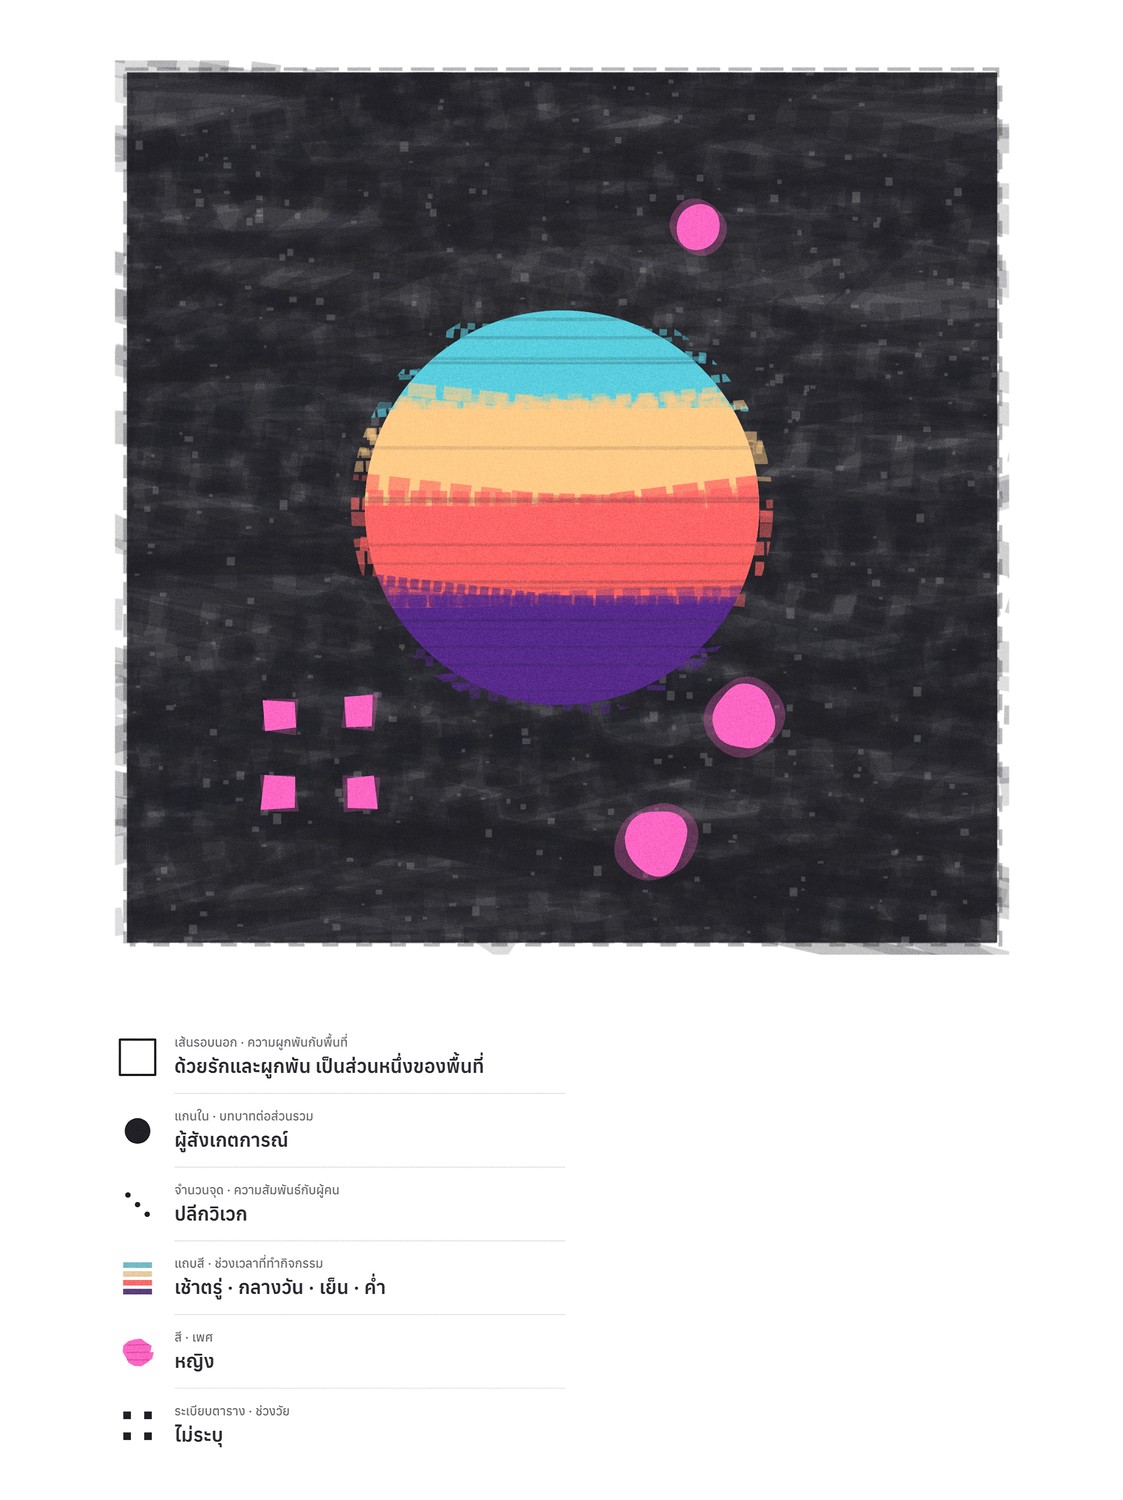
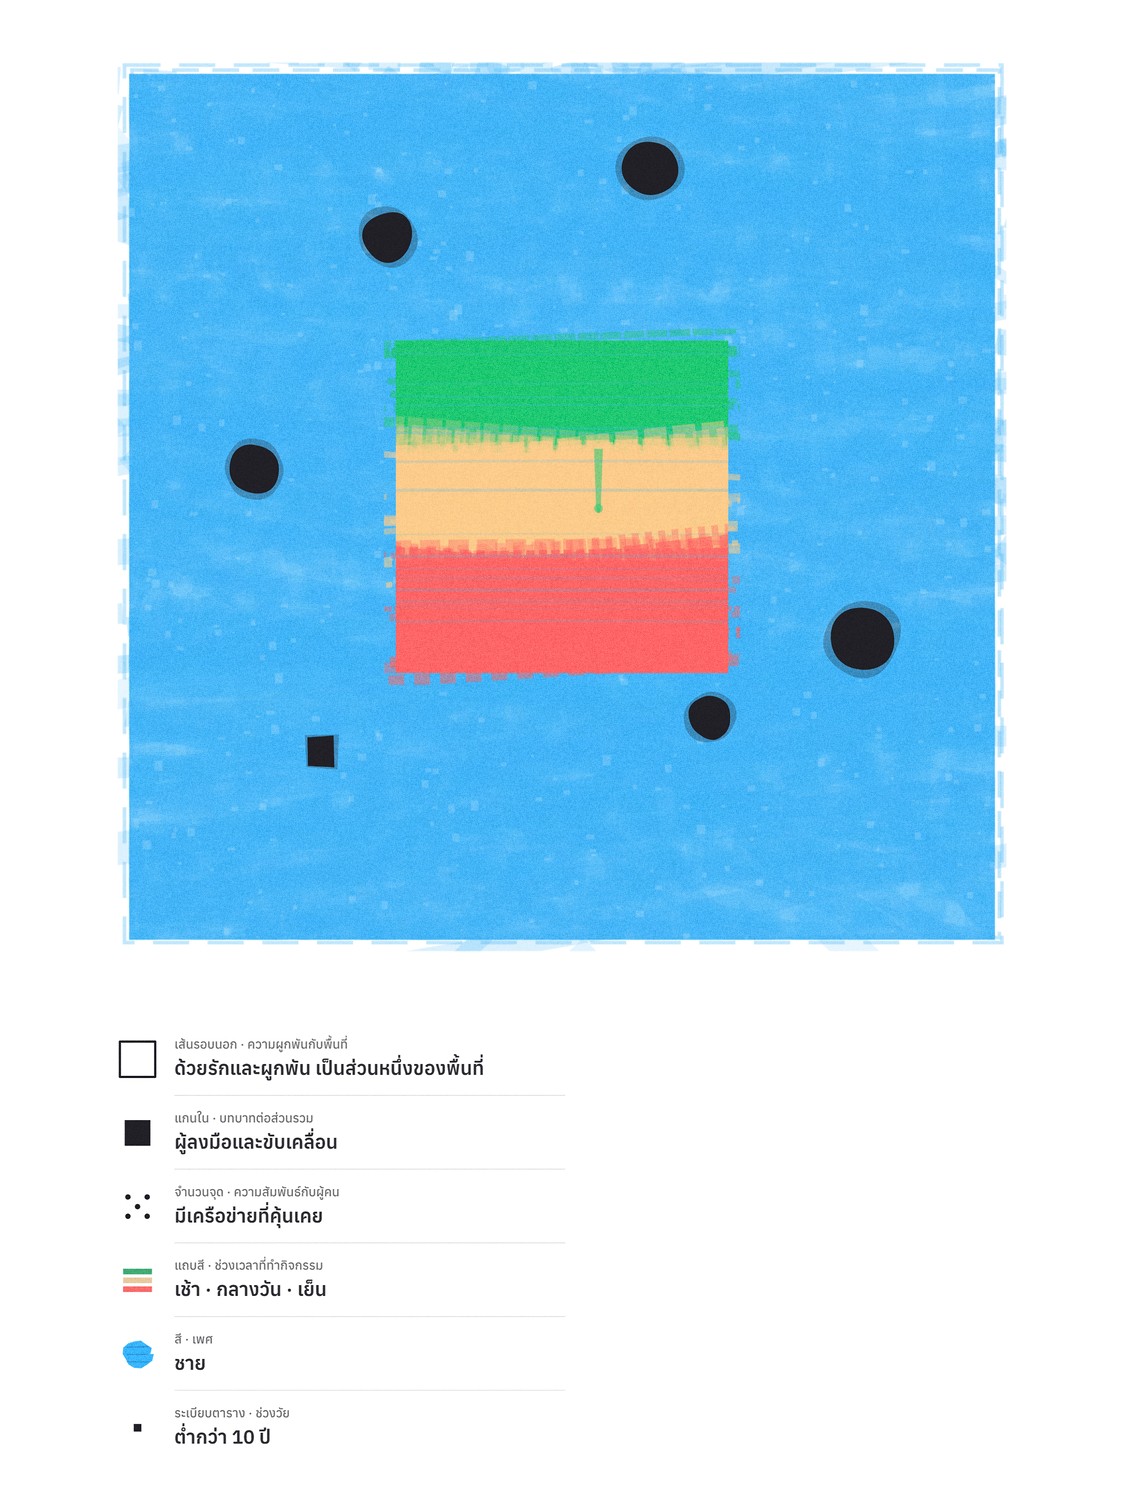
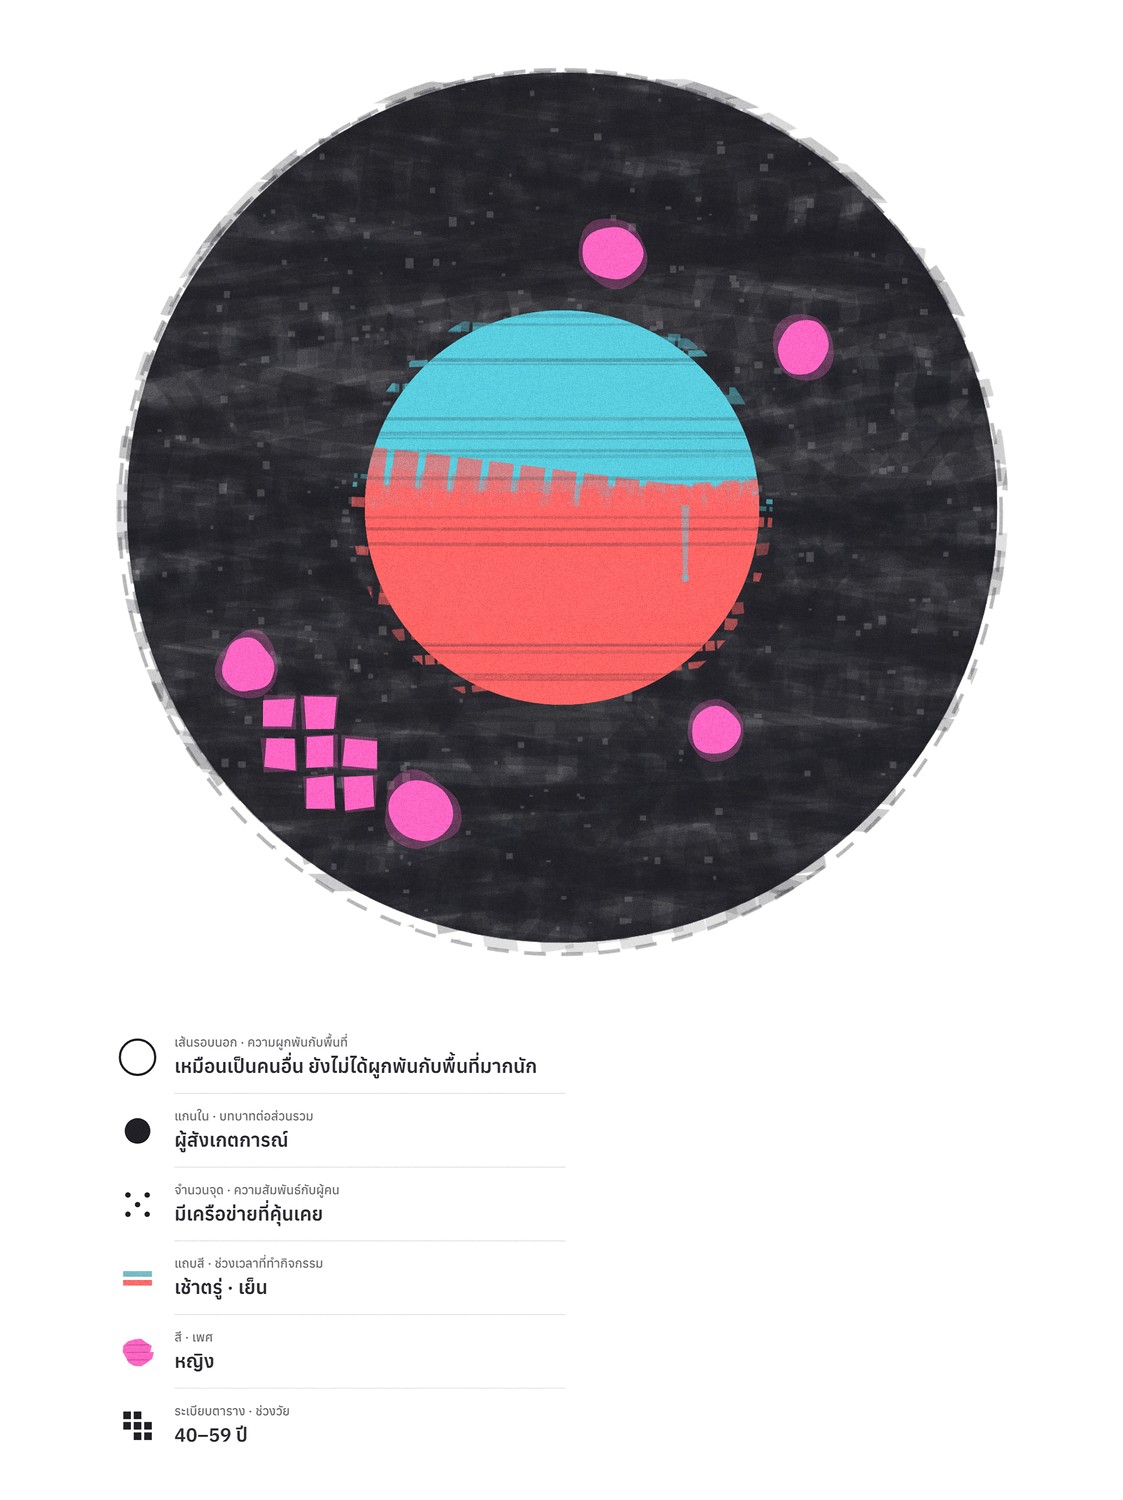
Data Portrait Legend: Interactive Demo
Each data portrait combines several variables derived from a participant’s responses, translating them into shape, colour, pattern, and visual marks. Try changing the variables to see how different combinations produce different portraits.
แถวบ้านในความทรงจำ:
Memory Lane เป็นโครงการวิจัยเชิงทดลองของ Future Curiosity Lab ภายใต้ Bangkok City Lab ที่ผมพัฒนาขึ้นเพื่อสำรวจว่า เราจะออกแบบกระบวนการเรียนรู้ความสัมพันธ์ของผู้คนกับแถวบ้าน ซึ่งมักเป็นเรื่องของประสบการณ์ ความรู้สึก พฤติกรรม และความสัมพันธ์กับผู้คนรอบตัว ฯลฯ เพื่อแปลงมาเป็นข้อมูลและนำมาศึกษาร่วมกันได้อย่างไร
โครงการนี้เริ่มจากการสร้างเครื่องมือเก็บข้อมูลจากการสะท้อนประสบการณ์ของแต่ละคน เช่น เราใช้เวลาอยู่แถวบ้านมากน้อยแค่ไหน รู้จักผู้คนรอบตัวหรือไม่ มีบทบาทกับพื้นที่อย่างไร และรู้สึกว่าตัวเองเป็นส่วนหนึ่งของชุมชนในระดับไหน จากนั้นจึงแปลงคำตอบทั่วไปในชีวิตประจำวันเหล่านี้ออกมาเป็นรูปแบบของคะแนนแบบหลายมิติ เพื่อสร้างชุดข้อมูลที่สามารถอ่านได้ทั้งในระดับบุคคล และระดับภาพรวม
แรงบันดาลใจของงานทดลองนี้ มาจากเรื่องเล่าเกียวกับสวนสตอว์เบอร์รี่ในวัยเด็กของลูกค้าท่านหนึ่ง ที่ผู้คนในหมู่บ้านมีเวลาไม่ตรงกัน ทำให้การจัดประชุมเพื่อทำอะไรร่วมกันแทบจะเป็นไปไมไ่ด้ แต่คนในหมู่บ้านมักจะไปรวมกันที่ผับในคืนวันศุกร์สุดสัปดาห์ ทางเจ้าหน้าที่ของทางการก็เลยใช้คืนวันศุกร์ในผับเป็นช่วงเวลาของการจัดกิจกรรมนวัตกรรมการพัฒนาพันธุ์สตอว์เบอร์รี่ในหมู่บ้าน ผลคือคนเรียนรู้ไปด้วย สังสรรค์ไปด้วย สนุกสนานกันไป แต่ก็ได้แลกเปลี่ยนความรู้ระหว่างสวน และได้เรียนรู้จากเจ้าหน้าที่เกษตรของเมือง ทุกวันนี้สตอว์เบอร์รี่ที่พัฒนาพันธุ์จากแถวบ้านเขา ว่ากันว่ารสชาติและคุณภาพสูงมากที่สุดแห่งหนึ่ง
คงจะดีถ้าแถวบ้านเรา สามารถพัฒนานวัตกรรมอะไรร่วมกันได้แบบสบายสบาย กันเอง เป็นธรรมชาติ (ไม่เด็กเรียนเกินไป) ก็เลยทดลองพัฒนาการเก็บข้อมูลของแถวบ้านในพื้นที่ต่าง ๆ ขึ้นมาดูก่อนครับ
โดยโครงการ Memory Lane แบ่งออกเป็น 3 ส่วน (module) ที่เชื่อมต่อกัน
Module 01 · Questionnaire
แบบสอบถามสั้น ๆ ใช้คำถามเกี่ยวกับชีวิตประจำวันเพื่อประเมินความสัมพันธ์ของผู้ตอบกับแถวบ้านในหลายมิติ ข้อมูลถูกประมวลผลผ่านเกณฑ์การให้คะแนนที่พัฒนาจากกรอบแนวคิดของโครงการ แล้วแปลงออกมาเป็น data portrait และหนึ่งใน 27 รูปแบบความสัมพันธ์กับย่าน พร้อมคำอธิบายในรูปแบบเซียมซีที่ช่วยให้ผู้ตอบอ่านและทบทวนความสัมพันธ์ของตัวเองกับพื้นที่ที่อาศัยอยู่
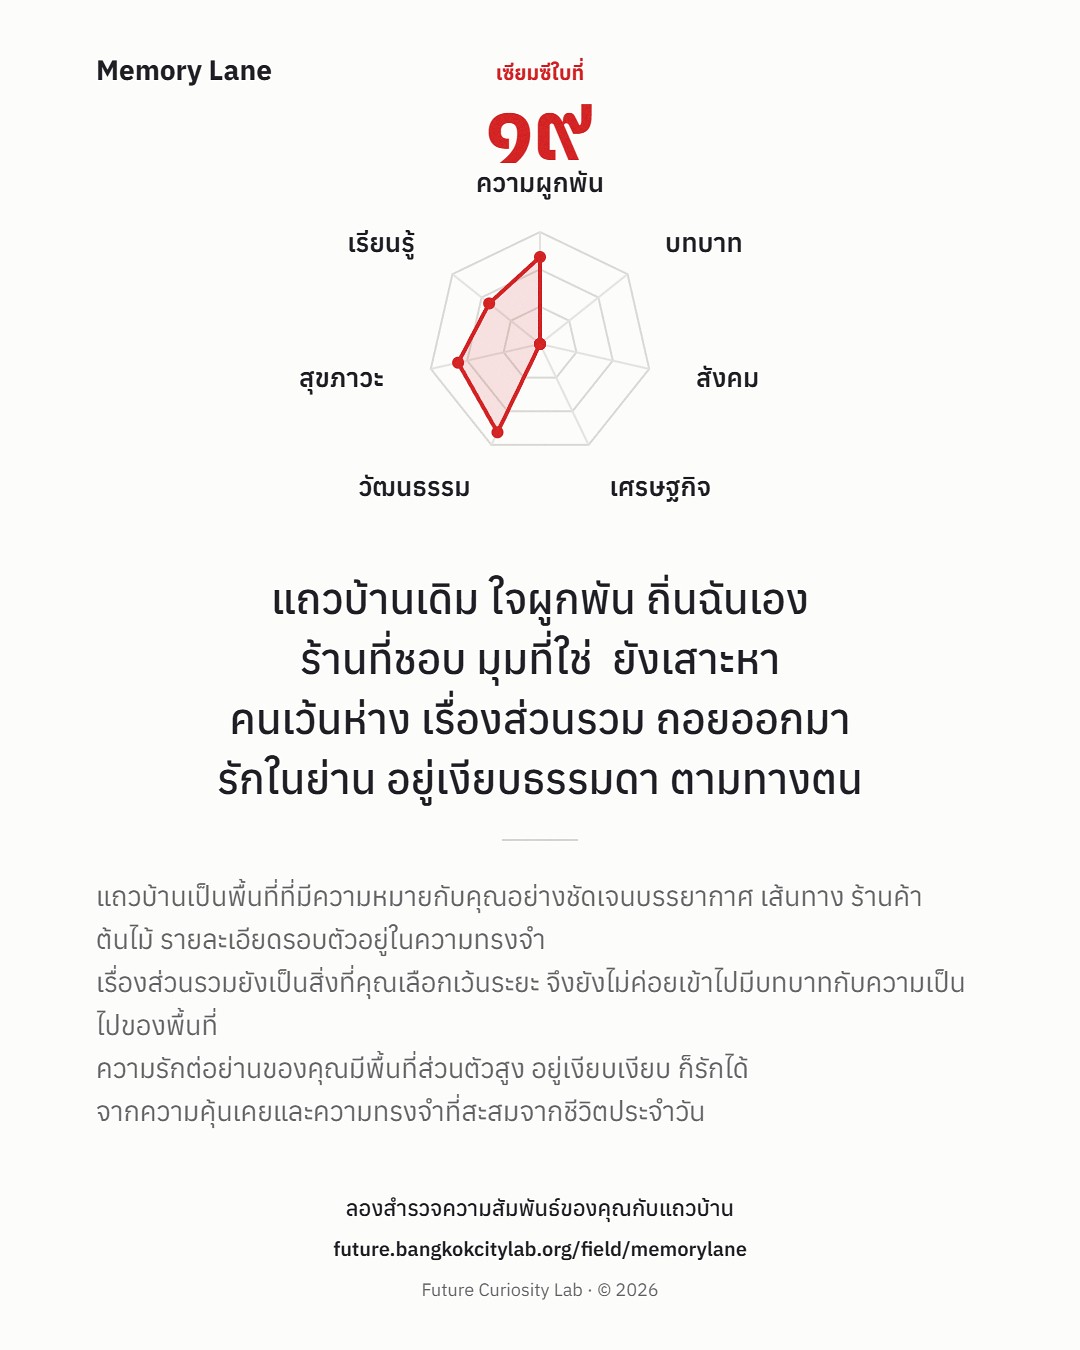
Module 01: Siemsi (fortune-slip) outcomes generated by the questionnaire scoring system.
Module 02 · Stock & Flow
ข้อมูลของผู้ตอบแบบสอบถามแต่ละคนถูกนำมาสร้างเป็น data portrait ที่มีรูปทรง สี ลวดลาย และองค์ประกอบต่าง ๆ ตามคำตอบ จากนั้นนำ portrait ของผู้เข้าร่วมทั้งหมดมารวมกัน เพื่อสร้างเป็นงานศิลปะเชิงการมีส่วนร่วม ขณะเดียวกันก็สามารถมองเห็นภาพรวมของผู้คนในเมืองผ่านเวลา พื้นที่ และความคิดที่มีต่อบริเวณแถวบ้านของตน
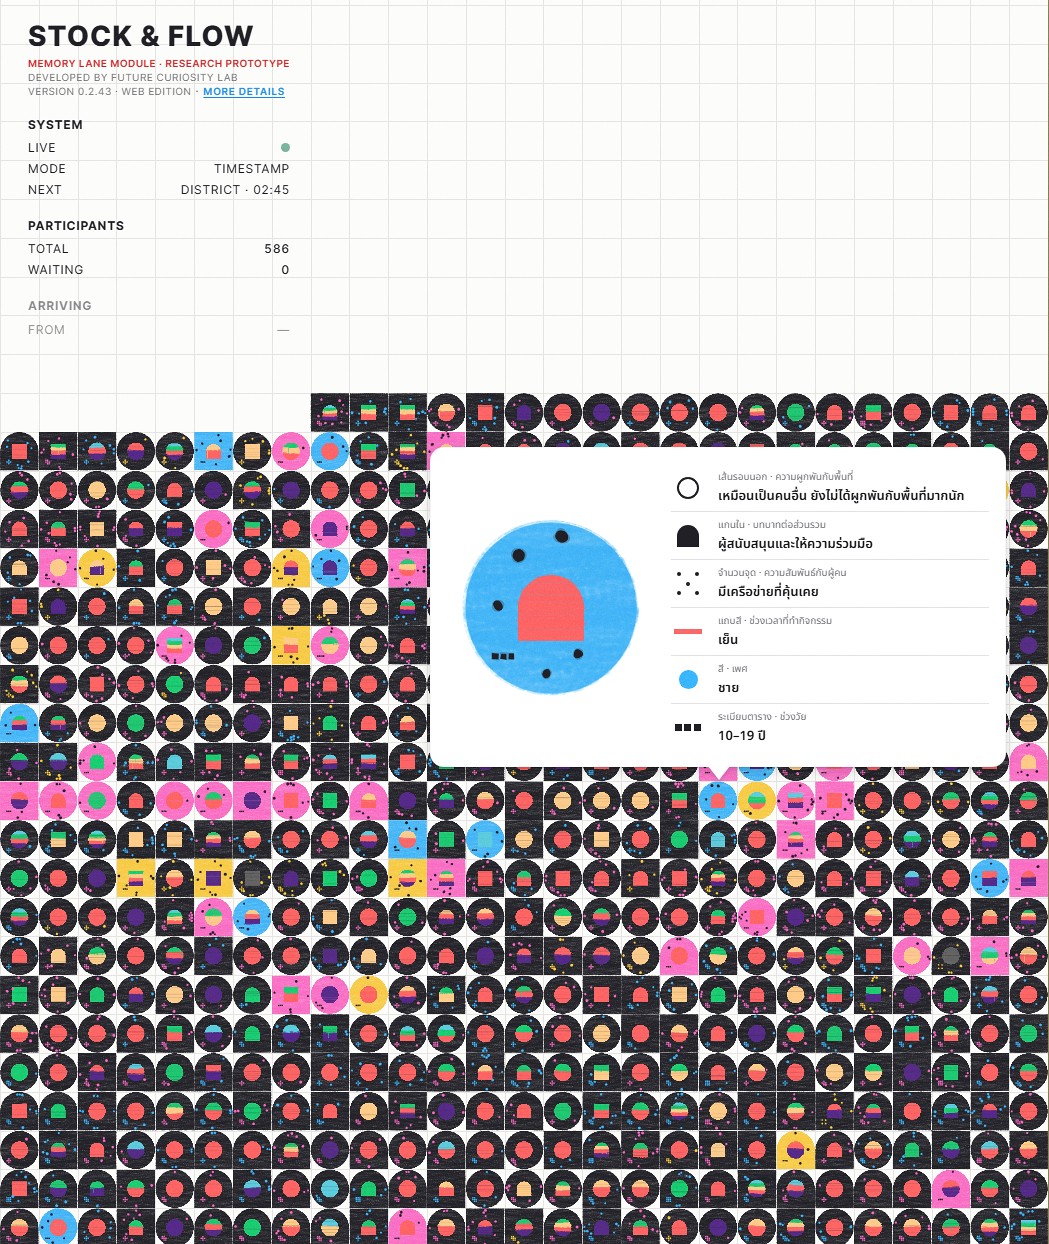
Module 02: Stock & Flow as a sound and data visualization, a participatory public art installation, and a continuously evolving collection of participant data.
Module 03 · Data Analysis
ข้อมูลชุดเดียวกันถูกนำมาสำรวจผ่าน customized dashboard เพื่อค้นหาระเบียบและรูปแบบความสัมพันธ์ เช่น ความสัมพันธ์ระหว่างพื้นที่ ช่วงเวลาที่ผู้คนใช้ชีวิตแถวบ้าน ลักษณะประชากร และรูปแบบความสัมพันธ์กับชุมชน
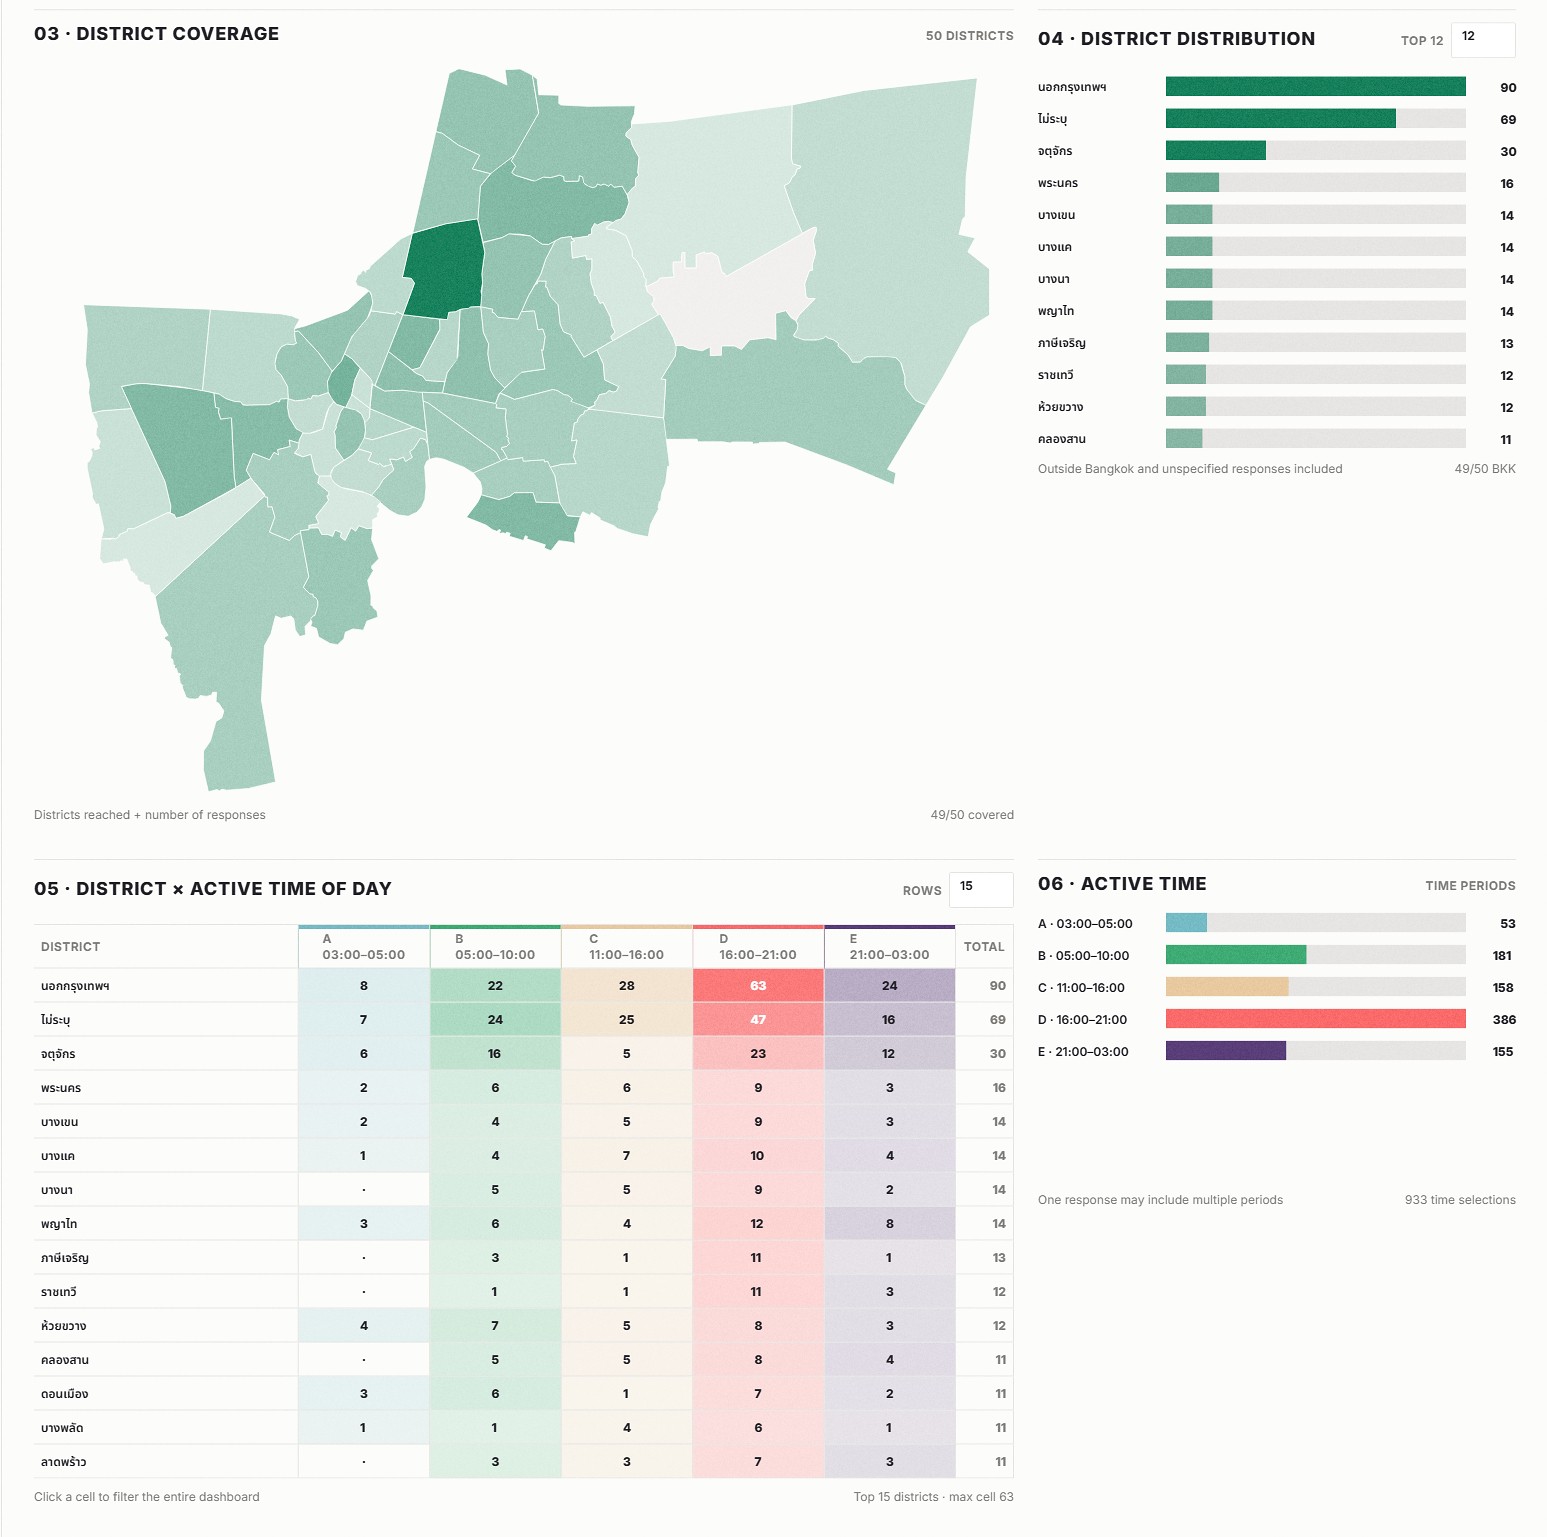
Module 03: Spatial distribution of responses across Bangkok and the relationship between district and active time of day.
ทั้งสามส่วนเป็นวิธีการทำความเข้าใจข้อมูลชุดเดียวกันจากคนละกรอบแนวคิด ตั้งแต่การทำความเข้าใจตัวเองของผู้ตอบ ไปสู่ภาพรวมที่เกิดจากการอยู่ร่วมกันของผู้คนจากคนละสถานที่และเวลา ต่อไปยังการวิเคราะห์รูปแบบของข้อมูลเพื่อทำความเข้าใจความสัมพันธ์ของผู้คนกับพื้นที่เมือง ในระดับที่กว้างขึ้นได้ครับ
ขอบคุณครับ
Saranont Limpananont
2026.09.19
Appendix A: Sound Design
Stock & Flow uses a generative sound system built with the Web Audio API to create a real-time interactive soundtrack.
A continuous ambient layer forms the background, while events in the visualization, such as movement, arrival, selection, and changes in formation, trigger additional sound events.
All sounds share the same harmonic language, based on open and suspended chords. This lets individual sounds overlap freely, without a fixed musical progression.
Sound events are scheduled independently and with controlled variation, so the composition is designed to keep evolving without a fixed repeating sequence.
Real-time synthesis
The engine generates all sounds directly in the browser using the Web Audio API. Oscillators, filters, gain, stereo positioning, delay, and dynamics are created and controlled in real time.
audioCtx = new (window.AudioContext || window.webkitAudioContext)();

const osc = audioCtx.createOscillator();
const gain = audioCtx.createGain();
const panner = audioCtx.createStereoPanner();

osc.connect(gain);
gain.connect(panner);
panner.connect(bus);
Harmonic Approach
Ambient layers and interaction sounds draw from the same chord families. The system moves mainly between open A (I) and D (IV) harmonies, with E major (V) appearing occasionally before resolving back to A.
const CHORDS = {
  // I
  SUS2: {
    pad: [110.00, 164.81, 246.94, 329.63, 440.00, 493.88],
    melody: [220.00, 246.94, 329.63, 440.00, 493.88, 659.25],
    birth: [493.88, 659.25, 880.00],
    land: [220.00, 329.63, 440.00]
  },

  SUS4: {
    pad: [110.00, 146.83, 164.81, 220.00, 293.66, 329.63],
    melody: [220.00, 293.66, 329.63, 440.00, 587.33, 659.25],
    birth: [587.33, 659.25, 880.00],
    land: [220.00, 329.63, 440.00]
  },

  A5G: {
    pad: [110.00, 164.81, 196.00, 220.00, 329.63, 392.00],
    melody: [196.00, 220.00, 329.63, 392.00, 440.00, 659.25, 783.99],
    birth: [392.00, 659.25, 783.99],
    land: [220.00, 329.63, 440.00]
  },

  // IV
  D_SUS2: {
    pad: [146.83, 220.00, 329.63, 440.00, 587.33, 659.25],
    melody: [293.66, 329.63, 440.00, 587.33, 659.25, 880.00],
    birth: [587.33, 659.25, 880.00],
    land: [293.66, 329.63, 440.00]
  },

  D_SUS4: {
    pad: [146.83, 196.00, 220.00, 293.66, 392.00, 440.00],
    melody: [293.66, 392.00, 440.00, 587.33, 783.99, 880.00],
    birth: [587.33, 783.99, 880.00],
    land: [293.66, 392.00, 440.00]
  },

  D6NO3: {
    pad: [146.83, 220.00, 246.94, 293.66, 440.00, 493.88],
    melody: [220.00, 246.94, 293.66, 440.00, 493.88, 587.33, 880.00],
    birth: [493.88, 587.33, 880.00],
    land: [220.00, 293.66, 440.00]
  },

  // V
  E_MAJOR: {
    pad: [164.81, 246.94, 329.63, 415.30, 493.88, 659.25],
    melody: [329.63, 415.30, 493.88, 659.25, 830.61, 987.77],
    birth: [659.25, 830.61, 987.77],
    land: [329.63, 493.88, 659.25]
  }
};

const A_CHORD_FAMILY = ['SUS2', 'SUS4', 'A5G'];
const D_CHORD_FAMILY = ['D_SUS2', 'D_SUS4', 'D6NO3'];
Relationship between visual and sound events
Actions in the visualization call different parts of the same sound engine, so movement and interaction become part of the composition rather than separate interface sounds.
events.on('arrivalStarted', ({ avatar }) => {
  playArrivalStart(avatar);
});

events.on('arrivalCompleted', ({ avatar }) => {
  playLanding(avatar);
});

events.on('formationStarted', () => {
  enterFormationHarmony();
});
In this sense, the sound design works as a set of conditions for an ambient composition shaped by the data its participants contribute.
Appendix B: Questionnaire & Scoring Calibration
Memory Lane's questionnaire uses indirect questions about everyday life to examine how people relate to their neighbourhoods. Many questions allow multiple selections, reflecting experiences that can belong to more than one dimension at the same time.
Responses are processed through a theory-led scoring model. Each question contributes to one or more dimensions through primary and secondary weights and question-specific aggregation rules. The model evaluates seven dimensions: Attachment, Participation, Social Connection, Community Economy, Cultural Capital, Wellbeing, and Curiosity.
Three dimensions, Attachment, Participation, and Social Connection, are classified into Low, Mid, and High levels. Their combinations form a 3 × 3 × 3 structure of 27 relationship archetypes, expressed through the siemsi outcomes.
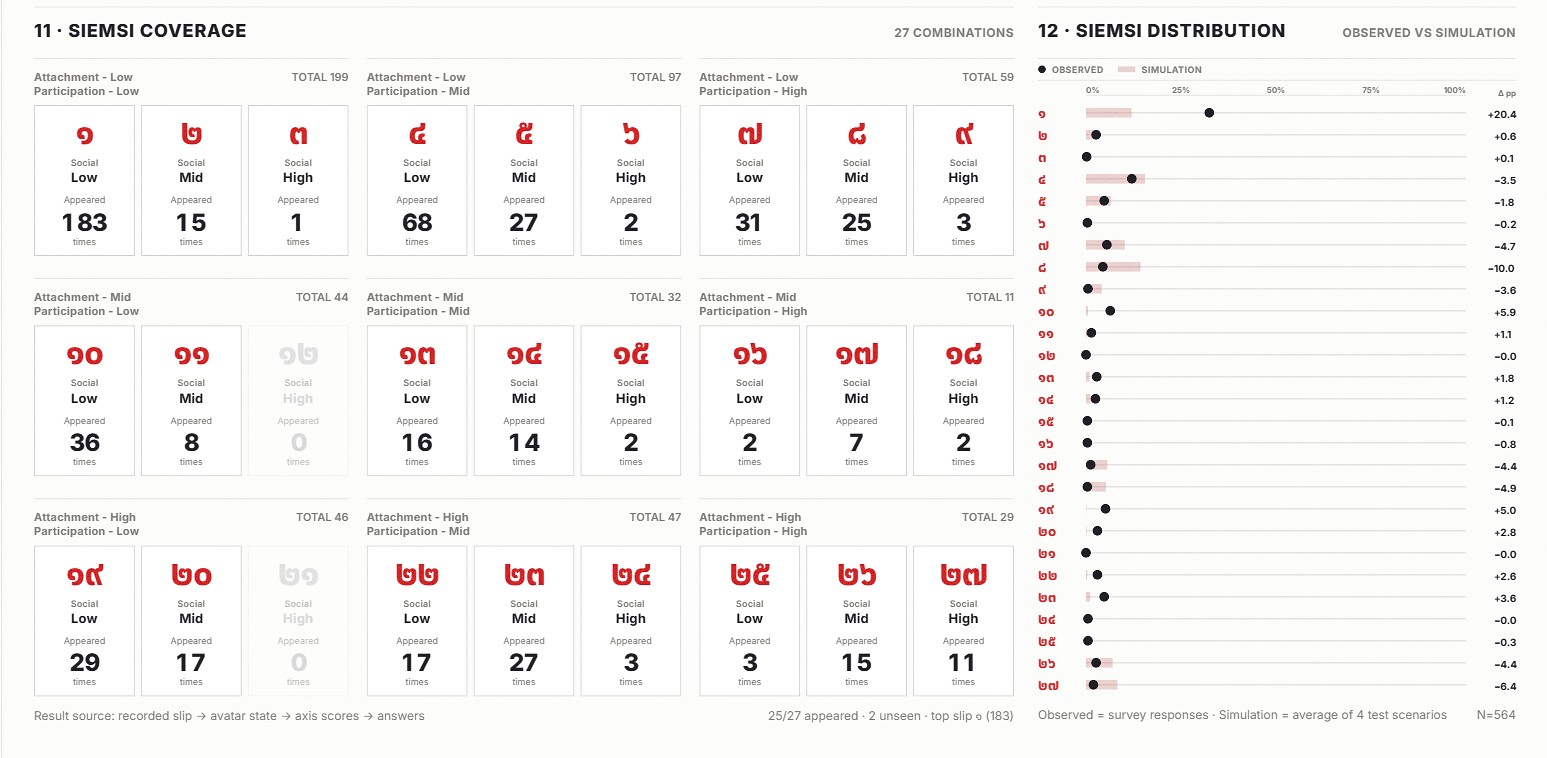
Distribution of observed siemsi (fortune-slip) outcomes compared with the average distribution across four simulated questionnaire scenarios.
The scoring model was refined through Monte Carlo simulation and early participant data. Simulated responses were used to examine score distributions, thresholds, item influence, dominant outcomes, and dead zones. These findings informed adjustments to weights and cut-off values while maintaining the intended meaning of each question and dimension.
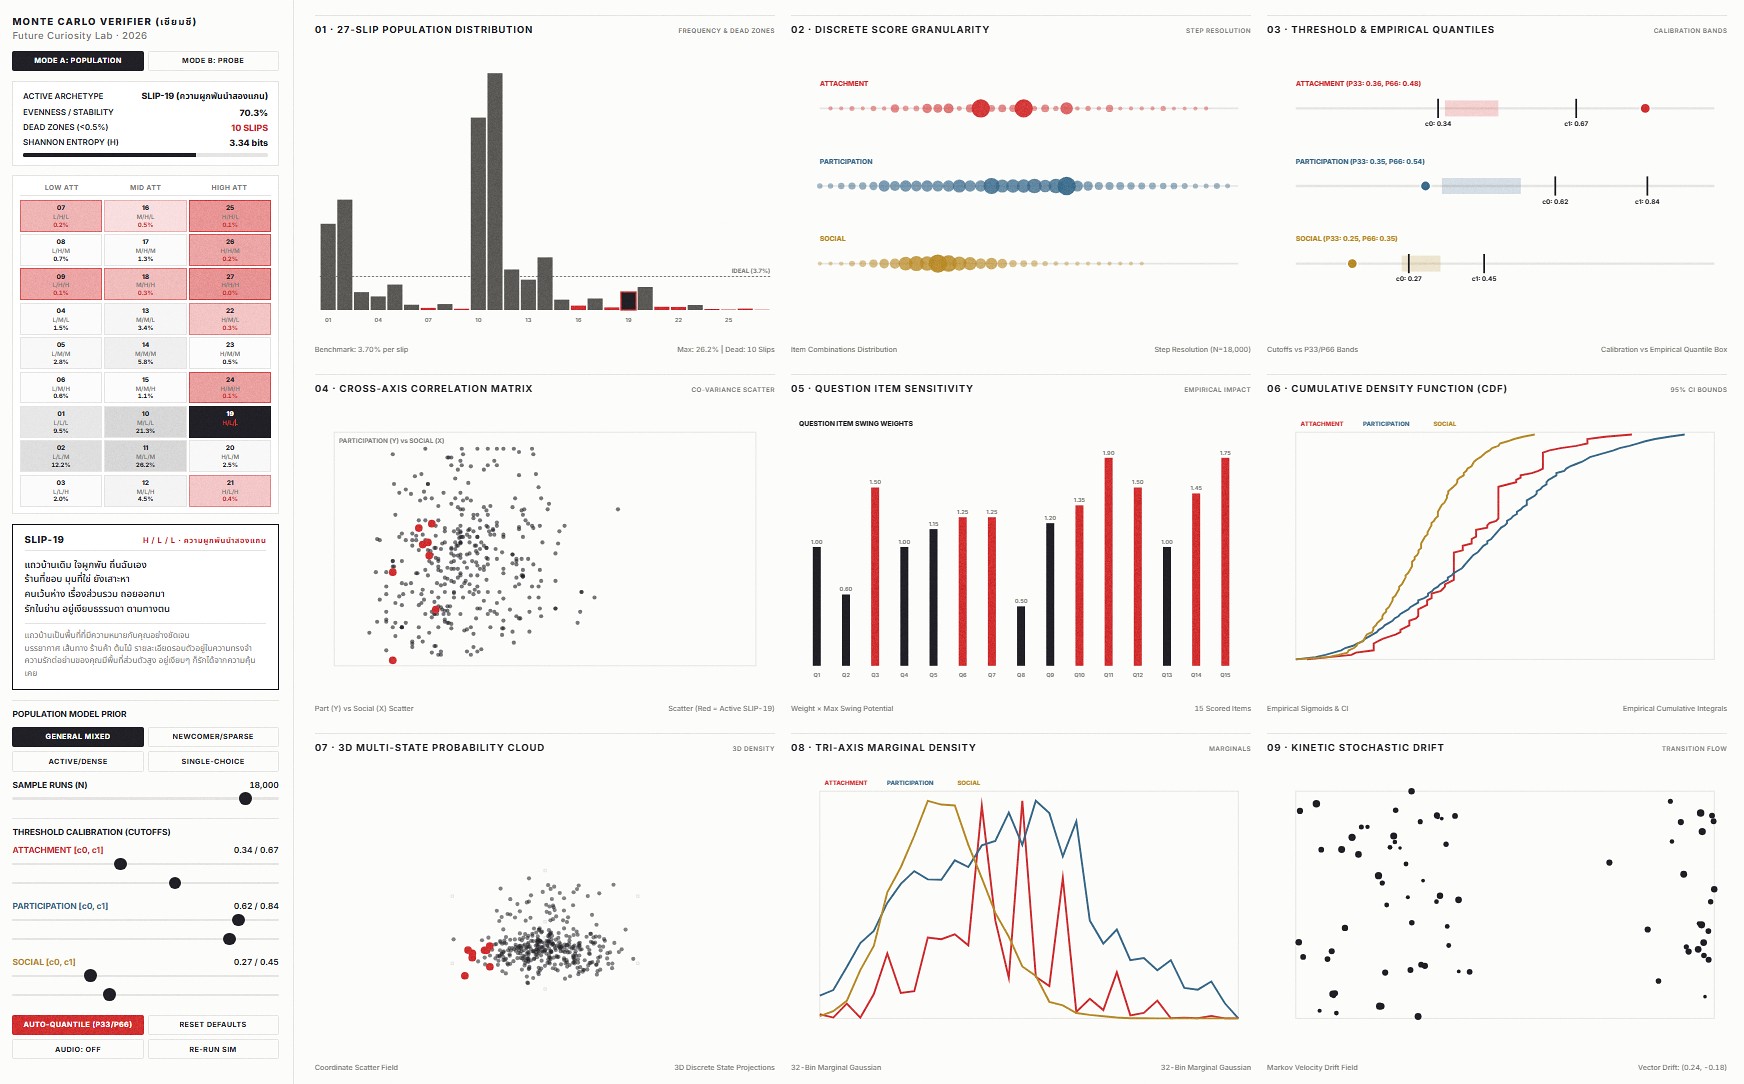
Monte Carlo simulation used to test question design, scoring weights, thresholds, and outcome distributions.
Credits:
Presented by Future Curiosity Lab, Bangkok City Lab, as a pilot project in Asynchronous Participation (พร้อมใจ ไม่ต้องพร้อมเพรียง), 1–13 September 2026, Exhibition Gallery, 3rd Floor, Bangkok Art and Culture Centre (BACC)
- Concept & Design Development: Studio Aeroplane Co., Ltd.
- Research & Scoring Model: Saranont Limpananont
- Data Visualization: Saranont Limpananont
- Questionnaire Design & Writing: Saranont Limpananont
- Software Development: Saranont Limpananont
- Sound Design: Saranont Limpananont
- Collective Composition: Every participant who contributed a response to Memory Lane
With thanks to everyone who participated. This project could not exist without participation; every response became part of the work itself.